Visual content in marketing: 94% more views await


TL;DR:
- Visual content increases engagement, retention, and sharing across digital platforms.
- Short-form videos and infographics offer the highest ROI for organic reach.
- Integrating visuals strategically from the start and automating with AI boosts marketing results.
Articles with images get 94% more views than text-only content, yet most marketing teams still treat visuals as decoration rather than strategy. That gap is where your competitors are winning. Visual content shapes how audiences process information, decide to share, and ultimately convert. This guide walks you through the evidence, the formats that matter most, and a practical system for weaving visuals into your SEO and content strategy. Whether you run a small business or manage a brand's digital presence, you'll leave with a clear framework for turning images, videos, and infographics into measurable growth engines.
Table of Contents
- How visual content transforms marketing results
- Why marketers and brands prioritize visual content
- Types of visual content and when to use each
- Integrating visual content into your marketing and SEO strategy
- The overlooked power of visuals: What most marketers miss
- Supercharge your visual content strategy with automation
- Frequently asked questions
Key Takeaways
| Point | Details |
|---|---|
| Visuals drive engagement | Content with quality visuals earns more views and interaction than text alone. |
| Marketer adoption soars | Over half of marketers use visuals in most content strategies because it delivers results. |
| Videos and images lead ROI | Short-form video and infographics are now among the most effective tools for digital growth. |
| SEO benefits multiply | Using visuals strategically not only boosts engagement but also enhances SEO outcomes. |
How visual content transforms marketing results
The numbers here are not subtle. Posts with images produce 650% higher engagement on Facebook compared to text-only posts. That is not a marginal improvement. That is a category difference, and it shows up across almost every platform and content type studied.
Why does this happen? The human brain processes visuals roughly 60,000 times faster than text. When someone scrolls a feed, an image registers before a headline does. That fraction-of-a-second advantage determines whether your content gets a click or gets skipped.
Beyond raw engagement, visuals improve content retention. People remember about 65% of information paired with a relevant image, compared to just 10% from text alone. For marketers building brand awareness, that retention gap is enormous. You want your message to stick, and visuals are the adhesive.
Here is a quick snapshot of how key visual formats compare on core performance metrics:
| Format | Engagement lift | Best channel | Primary goal |
|---|---|---|---|
| Static images | Up to 94% more views | Blog, email | Awareness, traffic |
| Short-form video | Highest reported ROI | Social, YouTube | Engagement, conversion |
| Infographics | 3x more shares | Blog, LinkedIn | Education, backlinks |
| GIFs | 2x click rate vs. static | Email, social | Attention, retention |
"Visual content is no longer a differentiator. It is the baseline expectation for any brand competing for attention online."
The formats driving the most impact right now include:
- Short-form video (under 60 seconds): dominates organic reach on Instagram, TikTok, and YouTube Shorts
- Custom illustrations and branded images: outperform stock photos in engagement and recall
- Infographics: earn significantly more backlinks than standard blog posts, which directly supports SEO
- Data visualizations: build authority and are frequently cited by other publishers
If you want to build content engagement strategies that compound over time, visuals are not optional. They are the mechanism that makes your content worth sharing. Explore the broader visual marketing stats landscape to see how these trends play out across industries.
Why marketers and brands prioritize visual content
The industry has spoken clearly on this. 50% of marketers say visual content is essential, and 88% use visuals in over half their published articles. These are not early adopters. This is mainstream practice, and brands not following suit are operating at a structural disadvantage.

The industries leading visual content adoption include e-commerce, media and entertainment, health and wellness, and B2B SaaS. What they share is a need to communicate complex or emotionally resonant ideas quickly. Visuals solve that problem better than any other format.
There are three core reasons brands invest heavily in visual content:
- Relatability: Images and video humanize a brand. A product photo or a behind-the-scenes clip creates a sense of familiarity that paragraphs of copy cannot replicate.
- Recall: As noted above, information paired with visuals is retained far longer. In a crowded market, being remembered is half the battle.
- Reach: Visual content is shared more often, which expands organic reach without paid amplification. Every share is essentially free distribution.
A comparison of how brands use visuals across content types shows a clear pattern:
| Content type | Visual usage rate | Primary visual format |
|---|---|---|
| Blog articles | 88% | Images, infographics |
| Social media posts | 95%+ | Video, images |
| Email campaigns | 65% | GIFs, product images |
| Landing pages | 80%+ | Video, hero images |
Understanding the fundamentals behind these choices is covered well in visual content concepts, and you can see how they fit into the bigger picture through content marketing trends shaping 2026.
Pro Tip: Consistency in visual style matters as much as quality. Brands that use a defined color palette, font set, and image treatment across all channels build recognition faster. Audiences start to identify your content before they even read the caption.
Types of visual content and when to use each
Not every visual format serves every goal. Choosing the wrong format wastes production time and dilutes your message. Here is a practical breakdown of what to use and when.
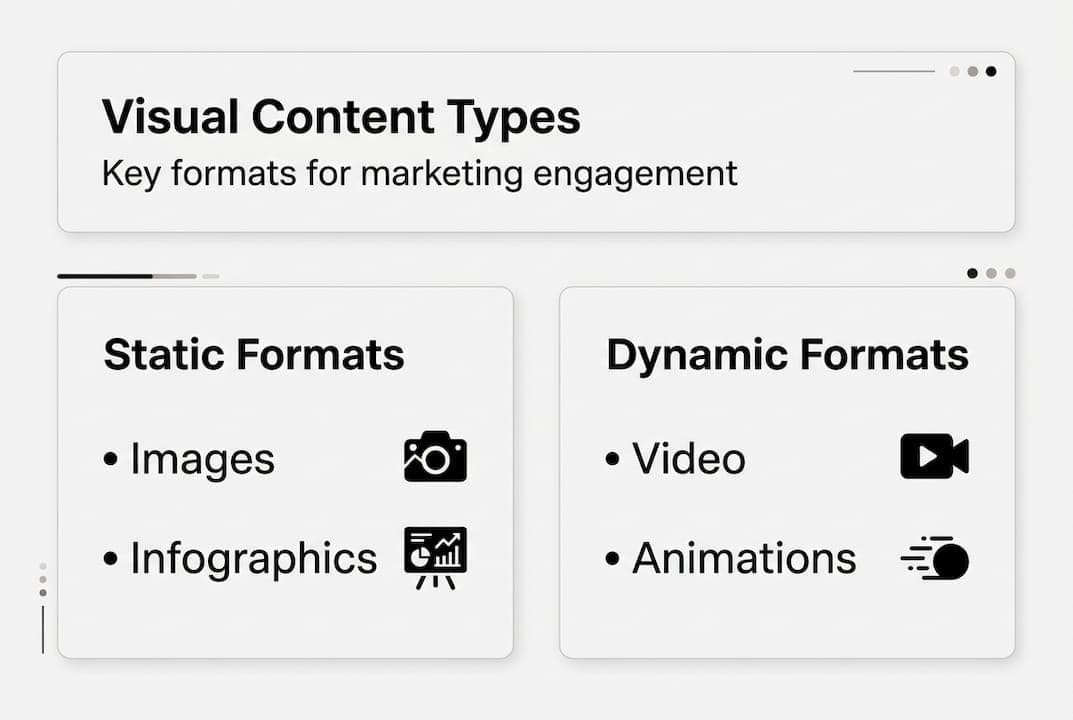
Static images are the most accessible format. They work well for blog posts, email headers, and social announcements. The key is using original or heavily customized images rather than generic stock photos, which audiences have learned to tune out.
Infographics shine when you need to simplify complex data or processes. They are particularly effective on LinkedIn and Pinterest, and they earn more backlinks than almost any other content type. If your goal is SEO authority, infographics are a high-leverage investment.
Video is the dominant format for engagement and conversion. Short-form video is rated as the top ROI format among marketers globally. Under 60 seconds for social, two to five minutes for educational content, and longer formats for webinars or product demos.
GIFs and motion graphics occupy a useful middle ground. They carry the attention-grabbing quality of video without the production cost. They work especially well in email campaigns and product walkthroughs.
Here is a quick guide to matching format with goal:
- Use images when you need speed, simplicity, or blog support
- Use infographics when your message involves data, steps, or comparisons
- Use short-form video when you want shares, reach, or product demos
- Use GIFs when you need to add energy to email or social without full video production
- Use long-form video for tutorials, case studies, or thought leadership
For a deeper look at how video integrates with organic search, explore video marketing for SEO. And if you want to understand how narrative structure amplifies visual impact, the visual storytelling power framework is worth your time.
Pro Tip: If you are resource-constrained, start with short-form video for social and infographics for your blog. These two formats consistently deliver the best return relative to production effort.
Integrating visual content into your marketing and SEO strategy
Visual content is used in over 50% of marketing articles and directly supports organic growth when implemented correctly. The challenge is not knowing that visuals matter. It is building a repeatable system to produce and optimize them at scale.
Here is a step-by-step approach that works:
- Audit your existing content: Identify which articles, pages, and social posts lack visuals or use low-quality stock images. These are your quick wins.
- Map visuals to content goals: Each piece of content should have a defined visual purpose, whether that is driving shares, explaining a concept, or supporting a conversion.
- Plan visuals by channel: Instagram needs square or vertical formats. LinkedIn favors infographics and data visuals. Blog posts perform best with custom header images and embedded charts.
- Optimize every visual for SEO: Add descriptive alt text to every image. Compress files to keep page load times fast. Use schema markup for video content so Google can index it properly.
- Use AI tools for scale: AI-driven platforms can generate on-brand visuals, auto-compress images, and even suggest visual formats based on content type. This removes the bottleneck of manual production.
Common pitfalls to avoid:
- Uploading oversized image files that slow page load and hurt rankings
- Using generic stock photos that reduce credibility and engagement
- Skipping alt text, which costs you both accessibility and SEO value
- Treating visuals as an afterthought added after copy is written
A data-driven content strategy will help you prioritize which content gaps to fill with visuals first. For inspiration on what this looks like in practice, content marketing examples from high-performing brands show the patterns clearly. Building effective content marketing systems means treating visuals as infrastructure, not decoration.
The overlooked power of visuals: What most marketers miss
Here is the uncomfortable truth: most brands add visuals at the end of their content process. Copy gets written, approved, and scheduled. Then someone drops in a stock photo before hitting publish. That workflow produces forgettable content.
The brands consistently outperforming their categories plan visuals from the start. They ask, "What does this concept look like?" before they ask, "What does this concept say?" That inversion changes everything. It leads to content that is built around a visual idea, not illustrated after the fact.
There is also a compounding effect that most marketers miss. A well-designed visual asset, like a strong infographic or a branded video series, continues generating shares, backlinks, and traffic long after publication. Text-only content rarely achieves that kind of longevity.
AI has changed the economics here significantly. High-quality, on-brand visuals used to require a design team or agency budget. Now, AI-powered tools can produce consistent visual assets at scale for a fraction of the cost. That levels the playing field for small businesses and solo marketers. Staying current with digital content trends means recognizing that visual strategy is now a core competency, not a creative luxury. Treat every visual as a strategic asset from day one.
Supercharge your visual content strategy with automation
Applying everything in this guide manually is possible, but it is slow. The marketers and business owners seeing the fastest organic growth are pairing strong visual strategies with AI-powered SEO automation that handles the repetitive, technical work.

Babylovegrowth.ai is built for exactly this. The platform's SEO automation platform handles content optimization, image alt text, and on-page SEO signals at scale, so your visual content actually ranks. If you are running a Webflow site, the Webflow SEO automation integration makes technical optimization seamless. And the backlink exchange ecosystem helps your visual-rich content earn the authority signals it deserves. Start your free trial and let the platform do the heavy lifting.
Frequently asked questions
How does visual content impact audience engagement?
Visual content dramatically increases engagement, with 650% more interaction reported on Facebook for posts that include images versus text-only posts. The effect is consistent across most digital platforms.
What types of visual content work best for organic growth?
Short-form video leads ROI among all visual formats, while high-quality custom images and infographics consistently drive organic reach, shares, and backlinks that support long-term search rankings.
Why do marketers rely more on visuals over text?
Visuals increase recall, sharing behavior, and time-on-page, all of which drive more visits and interactions. Articles with images earn 94% more views, making visuals essential in competitive digital spaces.
How do visuals contribute to better SEO performance?
Optimized visual content improves time-on-page, mobile experience, and clickthrough rates. Visual content boosts organic growth when paired with proper alt text, compression, and schema markup that search engines can read and reward.