Visual storytelling tips: boost your brand's impact


TL;DR:
- Most SMBs create visuals lacking a clear narrative, causing them to be ignored.
- Effective visual storytelling uses a three-act structure, positioning the customer as the hero.
- Balancing emotion-driven and data-driven visuals, supported by tools like Canva, enhances engagement and trust.
Most small and medium businesses pour time into creating visuals that simply get ignored. The problem is rarely budget or effort. It is usually a missing story. When your visuals lack a clear narrative, they blend into the noise instead of stopping the scroll. SMBs gain higher ROI from video and visuals than almost any other content format, yet most brands still treat images as decoration rather than communication. This guide walks you through the fundamentals, the tools, the process, and the metrics you need to build a visual storytelling system that actually moves people and drives measurable results for your brand.
Table of Contents
- Understanding the fundamentals of visual storytelling
- Essential tools and resources for SMB visual storytelling
- Step-by-step process for creating compelling visuals
- Troubleshooting, optimization, and measuring results
- Our take: Why memorable visuals start with authentic storytelling
- Next steps: Power up your marketing with automated tools
- Frequently asked questions
Key Takeaways
| Point | Details |
|---|---|
| Customer-hero narrative | Position your customer as the hero in visual stories to boost engagement and brand loyalty. |
| Tools for impact | Use accessible platforms like Canva and Infogram to quickly produce professional, brand-consistent visuals. |
| Framework-driven process | Follow step-by-step frameworks like EPIC and three-act structure for repeatably compelling results. |
| Measure and optimize | Track performance metrics and test visuals to continuously improve ROI and marketing effectiveness. |
| Authenticity wins | Avoid generic stock images; authentic visuals consistently create stronger brand memory for SMBs. |
Understanding the fundamentals of visual storytelling
Visual storytelling is not just about pretty pictures. It is a structured method for guiding your audience from a problem they recognize to a solution they trust. Without structure, even beautiful visuals fall flat. With the right framework, a single image or short video can do the work of a thousand-word article.
The most proven structure is the three-act narrative. Act one is the setup: you show your audience a world they recognize, complete with a real frustration or desire. Act two is the confrontation: the challenge intensifies, and your customer faces a decision. Act three is the resolution: your brand steps in as the guide and helps the hero, your customer, reach a better outcome. As three-act storytelling confirms, this positions the customer as the hero and your brand as the trusted guide, not the star of the show.
That shift in perspective changes everything. When your brand stops trying to be the hero and starts serving the hero, your audience feels seen. That emotional connection is what drives shares, saves, and conversions. You can boost brand engagement significantly just by reframing who the story is about.
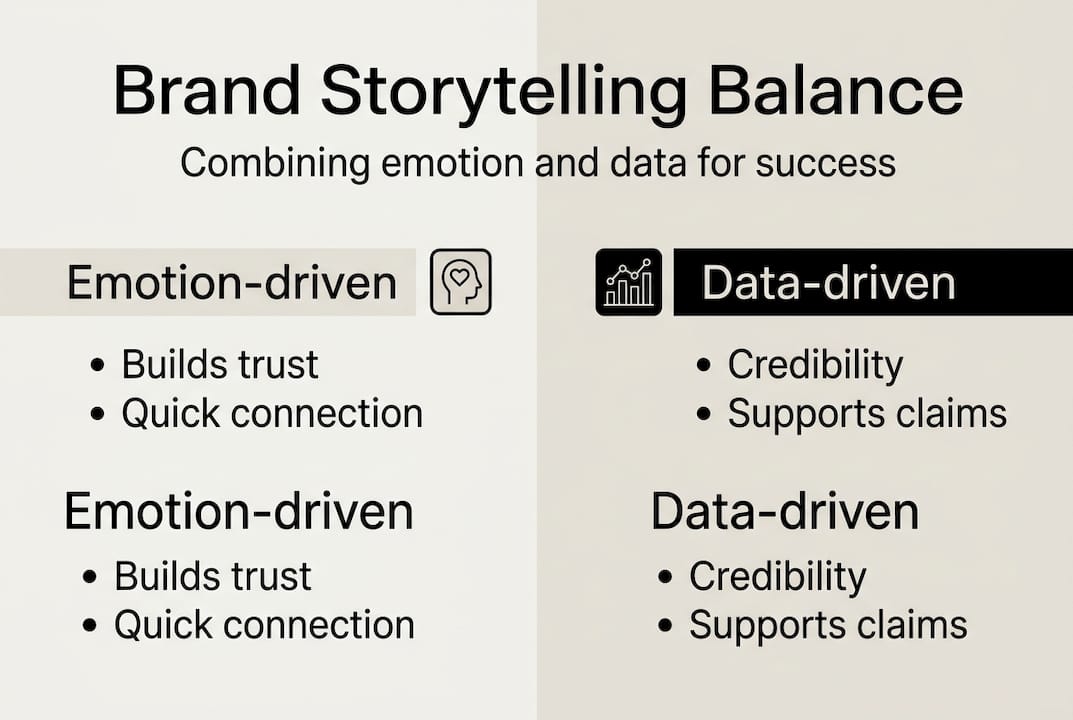
Two approaches dominate visual storytelling strategy:
- Emotion-driven visuals prioritize feeling. They use human faces, warm color palettes, and relatable moments to build trust and likeability fast.
- Data-driven visuals prioritize proof. They use charts, statistics, and infographics to build credibility and support decisions.
Neither approach wins every time. The strongest brands blend both, leading with emotion and backing it up with data. This is where the EPIC model becomes useful. EPIC stands for Essence, Personify, Inflect, and Catalog. It is a framework for building a visual identity that feels both consistent and human across every touchpoint.
| Approach | Strength | Best used for |
|---|---|---|
| Emotion-driven | Builds trust and likability fast | Social media, brand awareness |
| Data-driven | Supports decisions and builds credibility | Landing pages, sales content |
| Blended | Drives both engagement and conversions | Email campaigns, video ads |
Visual hierarchy is the other foundational concept every SMB needs. It is the practice of arranging visual elements so the viewer's eye moves in the order you intend. Size, contrast, color, and spacing all guide attention. Without hierarchy, your audience does not know where to look first, and your message gets lost. Understanding business growth storytelling and how narrative structure connects to visual layout will sharpen your approach considerably. Strong storytelling SEO impact also means that well-structured visual content ranks better and gets discovered more often.

Essential tools and resources for SMB visual storytelling
You do not need a design agency or a large budget to produce professional visual stories. The right tools make it possible for any SMB to create content that looks polished and communicates clearly.
Visual content tools like Canva and infographic platforms are genuinely accessible and highly effective for small businesses. They remove the technical barrier between your idea and a finished, shareable asset.
Here is a breakdown of the most useful tools by category:
| Tool | Type | Cost | Best for |
|---|---|---|---|
| Canva | Design platform | Free and paid | Social graphics, presentations |
| Infogram | Infographic builder | Free and paid | Data visualization |
| CapCut | Video editor | Free | Short-form video content |
| Adobe Express | Design and video | Free and paid | Brand-consistent templates |
| Piktochart | Infographic and report | Free and paid | Reports, visual summaries |
Free tiers on most of these platforms cover the basics well. Paid plans unlock brand kits, which let you lock in your colors, fonts, and logo so every asset looks consistent. That consistency is not cosmetic. It builds recognition over time, and recognition builds trust.
When choosing tools, prioritize ones that support:
- Visual hierarchy controls so you can guide the viewer's eye intentionally
- Brand kit features to maintain color and font consistency
- Template libraries for faster production without sacrificing quality
- Export options that match the platforms where you publish
Pro Tip: Start every new visual project with a template rather than a blank canvas. Templates are built with hierarchy and layout best practices already baked in. You will produce better work faster, and your output will stay more consistent across your team.
For SMBs focused on creating captivating content, the tool matters less than the habit. A weekly rhythm of producing and publishing visual content compounds over time. Pair that habit with solid visual content marketing tips and you will outpace competitors who only post when inspiration strikes. Tracking your output against visual content benchmarks helps you know when your effort is paying off.
Step-by-step process for creating compelling visuals
Having tools is one thing. Knowing how to use them in a repeatable process is what separates brands that grow from brands that just stay busy.
Follow this process every time you create a new visual asset:
- Storyboard your narrative. Write out the three acts in plain language before you open any design tool. Who is the hero? What is their problem? How does your brand help them win?
- Select visuals that match your story. Choose images, icons, or video clips that reflect your actual audience, not generic stock photos. Authentic visuals connect faster.
- Apply visual hierarchy. Place your most important element where the eye lands first. Use size and contrast to create a clear reading order. Visual hierarchy, rule of thirds, grids, and color palettes are the technical backbone of any professional layout.
- Apply your brand palette. Stick to two or three colors. Use your primary color for the most important element, and neutral tones for everything else.
- Test for clarity. Show the finished visual to someone unfamiliar with your brand. If they cannot tell you the main message in five seconds, simplify.
The EPIC brand approach adds another layer of intentionality. Essence means your visual captures your brand's core value. Personify means it features a relatable human presence. Inflect means it adapts tone for context. Catalog means it contributes to a growing library of consistent brand assets.
49% faster revenue growth. Companies using video visuals as part of their content strategy grow revenue nearly twice as fast as those that do not.
Pro Tip: For video content, always test your first frame as a static image. If the thumbnail does not communicate the story clearly on its own, your video will get skipped before it even starts. Understanding measuring content ROI helps you know which visuals are actually driving results, not just impressions. Pair that with content effectiveness measurement to build a feedback loop that improves every future asset.
Troubleshooting, optimization, and measuring results
Even well-intentioned visual content fails when common mistakes go unchecked. Knowing what to fix is just as important as knowing what to build.
The most frequent mistakes SMBs make in visual storytelling:
- Using generic stock images. Audiences recognize stock photos instantly, and they signal inauthenticity. Replace them with real photos of your team, your product, or your customers whenever possible. Authentic visuals build memory in ways that stock imagery simply cannot.
- Inconsistent branding across platforms. When your Instagram visuals look nothing like your email graphics, you lose the recognition effect. Use a brand kit and stick to it.
- Unclear layouts. Too many elements competing for attention create visual noise. Simplify ruthlessly. One message per visual.
- Ignoring mobile. Most of your audience sees your content on a phone. Design for the smallest screen first.
Once your visuals are live, measure what matters. The benchmarks are worth knowing:
Email visuals lift sales by 14%, and video grows revenue 49% faster than text-only content. These numbers set a realistic baseline for what good visual content can do.
For optimization, run simple A/B tests. Change one element at a time, the headline, the image, the color of a call-to-action button, and measure the difference. Real users will tell you more in 48 hours than any design theory can.
Track these metrics to gauge visual content performance:
- Engagement rate (likes, shares, saves, comments)
- Click-through rate on visual ads and email campaigns
- Conversion rate on landing pages with visual content
- Video completion rate
Connecting these numbers to marketing KPIs to track gives you a full picture of impact. Using analytics in marketing to interpret those numbers turns raw data into decisions that improve your next campaign.
Our take: Why memorable visuals start with authentic storytelling
Most brands treat visual content as a production problem. They ask, "How do we make more?" when the better question is, "How do we make it real?"
The brands that consistently outperform their competitors in visual storytelling are not the ones with the biggest design budgets. They are the ones that commit to authenticity and iteration. They test. They learn. They adjust. They show real people, real moments, and real outcomes.
Some prioritize emotion, others prioritize data, but the most effective SMBs balance both. They lead with a story that feels human and back it up with proof that builds confidence.
The uncomfortable truth is that most SMBs skip the testing phase entirely. They publish and move on. But the brands that build visual content impact over time are the ones that treat every published visual as a hypothesis, not a finished product. Build testing and iteration into your workflow from day one, and your visuals will compound in effectiveness month after month.
Next steps: Power up your marketing with automated tools
You now have the frameworks, the tools, and the process to build visual stories that connect and convert. The next challenge is scale. Producing consistent, high-quality content week after week is where most SMBs stall.
Babylovegrowth.ai is built for exactly this challenge. Our SEO automation platform handles the content production and optimization work so you can focus on strategy and creativity. Pair that with our backlink building software to amplify the reach of every visual asset you create. Visit our digital marketing solutions hub to explore how automation and AI can turn your visual storytelling efforts into a scalable growth engine for your brand.
Frequently asked questions
What is the best structure for visual storytelling in SMB marketing?
The three-act structure positions your customer as the hero and your brand as the guide, moving through setup, confrontation, and resolution. This framework consistently outperforms unstructured visual content in engagement and recall.
Which visual tools are most effective for small businesses?
Free tools like Canva and Infogram give SMBs professional-grade design and infographic capabilities without requiring advanced skills or a large budget.
How can I measure the impact of visual content on my marketing results?
Track engagement rates, click-through rates, and conversion lifts. Email visuals lift sales by 14% on average, and video content drives revenue growth 49% faster than text-only formats.
What mistakes should I avoid in my SMB visual storytelling?
Avoid generic stock images, inconsistent branding across channels, and cluttered layouts. These three mistakes undermine authenticity and reduce how well your audience remembers your brand.
Should SMBs focus on emotion or data in their visuals?
Balance both. Emotion versus data is not an either-or choice. Lead with an emotional hook to capture attention, then support it with data to build credibility and drive action.
Recommended
Smart SEO,
Faster Growth!
Most Read Articles
Generative Engine Optimization (GEO)
Learn how Generative Engine Optimization (GEO) helps your content rank in AI search engines like ChatGPT and Google AI. This comprehensive guide explains the differences between SEO and GEO, why it matters for your business, and practical steps to implement GEO strategies for better visibility in AI-generated responses.
Track LLM Traffic in Google Analytics 4 (GA4)
Learn how to track and analyze traffic from AI sources like ChatGPT, Claude, Perplexity, and Google Gemini in Google Analytics 4. This step-by-step guide shows you how to set up custom filters to monitor AI-driven traffic and make data-driven decisions for your content strategy.
How to Humanize AI Text with Instructions
Learn practical techniques to make AI-generated content sound more natural and human. This guide covers active voice, direct addressing, concise writing, and other proven strategies to transform robotic text into engaging content.
Open AI Revenue and Statistics (2024)
Comprehensive analysis of OpenAI financial performance, user engagement, and market position in 2023. Discover key statistics including $20B valuation, $1B projected revenue, and 100M+ monthly active users.