How to analyze website traffic for SEO growth in 2026


Many business owners collect mountains of website data but struggle to extract actionable insights that drive real SEO results. Raw traffic numbers mean nothing without proper analysis and interpretation. This guide provides a systematic framework to transform your traffic data into a strategic asset, helping you identify opportunities, fix issues, and achieve scalable organic growth through informed decisions.
Table of Contents
- Introduction To Website Traffic Analysis
- Prerequisites: Tools And Data You Need Before Starting
- Step-By-Step Method To Analyze Website Traffic For Seo Impact
- Common Mistakes And How To Avoid Them In Traffic Analysis
- Expected Outcomes: How To Measure Success And What To Expect
- Boost Your Seo Analysis With Babylovegrowth Tools
- Faq
Key takeaways
| Point | Details |
|---|---|
| Right tools matter | Google Analytics and SEO platforms provide the foundation for accurate traffic analysis and competitive insights. |
| Segment your data | Breaking down traffic by source, device, and campaign reveals hidden patterns and optimization opportunities. |
| Quality over quantity | Focus on engagement metrics and conversions rather than vanity metrics like total pageviews. |
| Avoid common errors | Ignoring mobile traffic, skipping bot filtering, and poor segmentation lead to flawed decisions. |
| Timeline expectations | SEO improvements from traffic analysis typically appear within 3 to 6 months of implementing changes. |
Introduction to website traffic analysis
Website traffic analysis is the systematic examination of visitor behavior, sources, and engagement patterns to inform strategic decisions. For SEO success, this process goes beyond counting visitors. You need to understand where users come from, how they interact with your content, and what drives conversions.
Analyzing traffic is crucial because it reveals what works and what doesn't in your SEO strategy. Without proper analysis, you're essentially flying blind, making decisions based on gut feelings rather than data. Google Analytics provides comprehensive data on user behavior, traffic sources, and conversion tracking essential for SEO optimization.
The right tools make all the difference. Google Analytics remains the industry standard for tracking website performance. It captures user sessions, pageviews, bounce rates, and conversion paths automatically once properly configured. For deeper competitive insights, paid platforms like SEMrush and Ahrefs reveal keyword rankings, backlink profiles, and competitor strategies that inform your approach.
Traffic data drives every meaningful SEO decision. Which content formats resonate with your audience? What keywords bring qualified visitors? Where should you invest content creation efforts? Analytics answers these questions with evidence, not assumptions. By understanding your website analytics, you can allocate resources effectively and maximize ROI on SEO initiatives.
The difference between successful and struggling websites often comes down to how well teams interpret and act on traffic data. Start treating analytics as a strategic asset rather than just a reporting tool.
Prerequisites: tools and data you need before starting
Before diving into analysis, you need the right foundation. Setting up Google Analytics with proper tracking is non-negotiable. This means installing tracking codes correctly, configuring goals for conversions, and enabling enhanced measurement features. Over 29 million websites rely on Google Analytics in 2026, proving its foundational role in traffic analysis.
Paid SEO tools complement free analytics platforms by providing competitive intelligence. SEMrush reveals what keywords competitors rank for and estimates their traffic. Ahrefs maps backlink profiles and identifies content gaps. These insights help you understand your market position and discover untapped opportunities.
Essential baseline metrics to understand:
- Sessions: Individual visits to your site, crucial for measuring overall traffic volume
- Bounce rate: Percentage of single-page visits, indicating content relevance and engagement
- Conversion rate: Visitors completing desired actions, the ultimate measure of traffic quality
- Average session duration: Time spent on site, reflecting content value and user interest
- Pages per session: Depth of engagement showing how well your internal linking performs
| Tool Type | Primary Use | Cost Model | Best For |
|---|---|---|---|
| Google Analytics | Comprehensive behavior tracking | Free | All businesses starting traffic analysis |
| SEMrush | Keyword and competitor research | Paid subscription | Content strategy and competitive insights |
| Ahrefs | Backlink analysis and content gaps | Paid subscription | Link building and content optimization |
| Google Search Console | Search performance and indexing | Free | Technical SEO and search visibility |
Clean, accurate data is the foundation of reliable insights. Implement proper UTM parameters for campaign tracking. Set up filters to exclude internal traffic from employees. Configure cross-domain tracking if you operate multiple properties. Small tracking errors compound over time, leading to major misinterpretations.
Pro Tip: Schedule monthly audits of your tracking setup to catch configuration drift. Check that goals still fire correctly, filters work as intended, and new pages have proper tags. Discovering a broken tracking code six months late means losing half a year of valuable data. Use analytics tools for organic SEO to maintain data quality and maximize insights from your traffic.
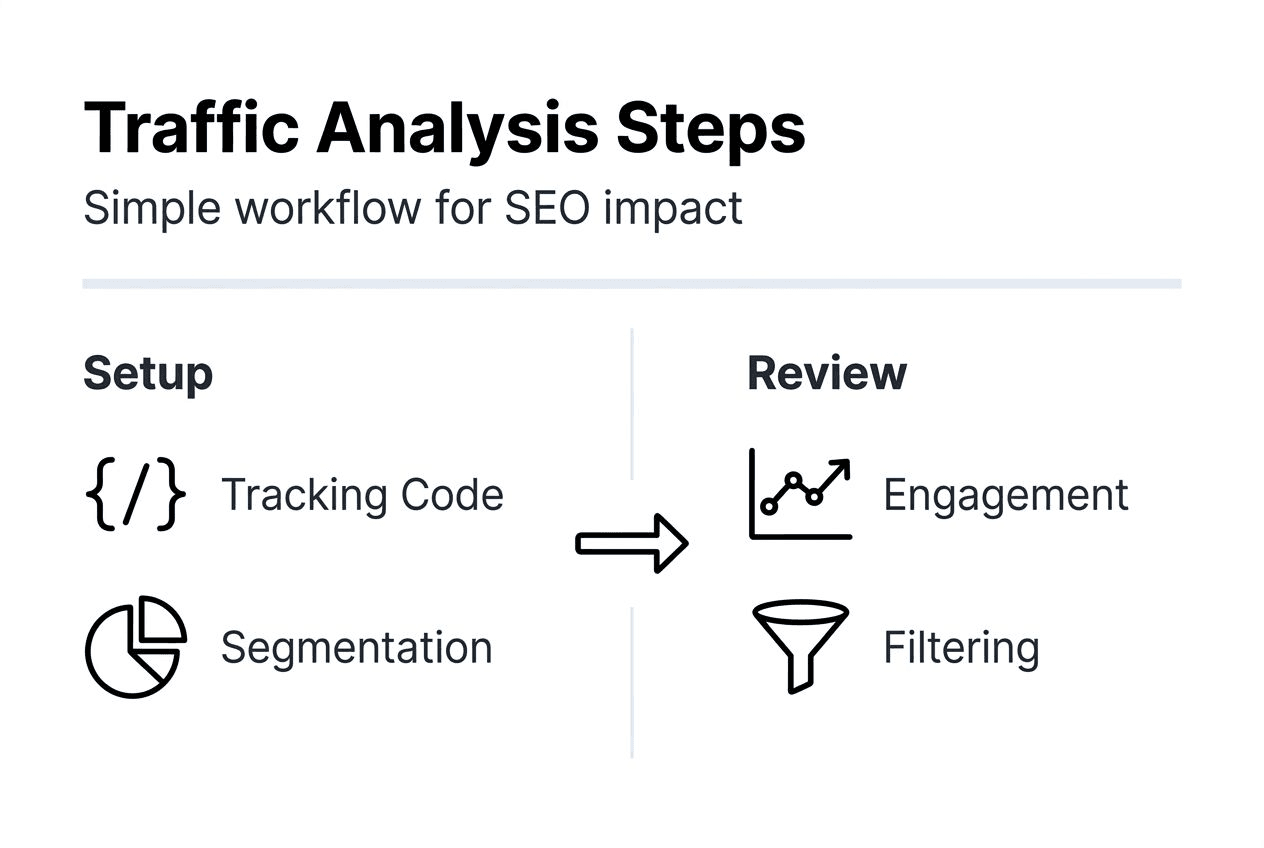
Step-by-step method to analyze website traffic for SEO impact
Effective traffic analysis follows a logical sequence. Each step builds on previous insights, creating a comprehensive picture of your SEO performance. Structured analysis methods improve SEO success rates by 25% compared to ad hoc approaches.
1. Set up and verify traffic tracking
Confirm that analytics codes fire on all pages. Use browser extensions or tag management previews to validate implementation. Check that conversions register correctly by completing test transactions or form submissions yourself.
2. Segment data by channel, device, and campaigns
Break down traffic into meaningful categories. Organic search behaves differently from social media traffic. Mobile users have distinct patterns compared to desktop visitors. Segmentation reveals which sources deliver quality engagement.
| Segment Type | What It Reveals | Key Metrics to Watch |
|---|---|---|
| Traffic source | Which channels drive visitors | Sessions, conversion rate by source |
| Device category | Mobile vs desktop performance | Bounce rate, pages per session by device |
| Landing page | Entry point effectiveness | Exit rate, goal completions per page |
| Geographic location | Regional performance differences | Sessions and revenue by country/region |
3. Analyze engagement metrics prioritizing quality
Total pageviews look impressive but mean little without context. Focus on bounce rate, time on page, and conversion funnels instead. A page with 1,000 visitors and 2% conversion rate outperforms one with 10,000 visitors and 0.1% conversion.

4. Detect and filter bot and spam traffic
Bot traffic inflates metrics and skews decision making. Enable bot filtering in Google Analytics settings. Review referral sources for suspicious domains generating zero engagement. Create filters to exclude known spam sources from reports.
5. Formulate hypotheses and test changes iteratively
Use insights to develop testable theories. "Mobile bounce rate is high because page load time exceeds 3 seconds" becomes a hypothesis you can validate. Implement changes systematically and measure results over defined periods.
6. Use visualization dashboards to monitor trends
Create custom dashboards highlighting your most important metrics. Track organic traffic trends, conversion rates, and goal completions in real time. Share visualizations with stakeholders to communicate insights effectively and align strategy.
Pro Tip: Leverage AI-powered SEO workflows to automate repetitive analysis tasks. Machine learning algorithms can spot patterns humans miss, like subtle seasonality effects or emerging keyword opportunities. This frees your time for strategic thinking while ensuring nothing slips through the cracks.
Common mistakes and how to avoid them in traffic analysis
Even experienced marketers fall into predictable traps that undermine analysis accuracy. Recognizing these errors helps you avoid costly missteps and extract genuine value from your data.
Ignoring mobile traffic data
Mobile devices generate over half of all web traffic in 2026. Ignoring mobile traffic data leads to underestimating 55% of overall website traffic and results in flawed SEO decisions. Always segment by device and optimize experiences for mobile users specifically.
Overreliance on vanity metrics
Pageviews and total sessions feel good but don't drive business outcomes. A visitor who bounces after one second counts the same as one who spends five minutes reading. Shift focus to engagement depth, conversion rates, and revenue attribution instead.
Failing to filter bot and referral spam
Spam traffic can represent 20-30% of reported sessions on poorly configured sites. These fake visits inflate numbers and mask real trends. Enable bot filtering and regularly audit referral sources for suspicious patterns.
Poor segmentation of traffic sources
Lumping all traffic together creates misleading averages. Organic search visitors behave differently from paid ad clicks or social media referrals. Analyze each channel separately to understand true performance and optimization opportunities.
Misconfiguring analytics tools
Wrong timezone settings, missing goal configurations, and broken tracking codes create unreliable data. A single misconfigured filter can exclude crucial traffic segments. Document your analytics setup and review configurations quarterly to catch drift.
"The biggest mistake in traffic analysis is treating all visitors equally. A targeted organic visitor worth $100 in lifetime value shouldn't be measured the same as a bot or accidental click. Quality always trumps quantity."
How to fix these issues:
- Schedule weekly reviews of mobile vs desktop performance metrics
- Create custom dashboards focusing on revenue and conversion metrics only
- Implement view filters excluding known bot networks and spam domains
- Build separate reports for each major traffic channel with tailored KPIs
- Maintain a change log documenting all analytics configuration updates
Avoiding these mistakes keeps your analysis grounded in reality. Clean data leads to confident decisions and better SEO outcomes.
Expected outcomes: how to measure success and what to expect
Setting realistic expectations prevents frustration and helps you stay committed to data-driven SEO. Results take time, but proper measurement reveals progress even before massive traffic spikes occur.
SEO impact typically becomes visible within 3 to 6 months after implementing analysis-driven changes. This timeline accounts for Google crawling updated content, reassessing rankings, and building authority signals. Patience combined with consistent optimization yields sustainable growth.
Key success metrics to track:
- Organic traffic quality: Increased session duration and pages per session from search visitors
- Bounce rate improvements: Lower bounce rates signal better content relevance and user experience
- Conversion rate growth: More visitors completing desired actions validates traffic quality
- Keyword ranking progression: Movement up SERPs for target terms demonstrates SEO effectiveness
- Competitive position: Closing gaps with rivals in organic visibility and traffic share
Benchmarking against competitors provides context for your performance. If you gain 20% organic traffic while competitors grow 40%, you're losing ground despite absolute gains. Use tools to track competitor metrics and adjust strategy accordingly.
Iterative testing reduces campaign failure rates significantly. Rather than betting everything on one approach, test multiple variations and double down on winners. Small continuous improvements compound into major advantages over time.
| Metric | Baseline (Month 0) | After 3 Months | After 6 Months | Improvement |
|---|---|---|---|---|
| Organic sessions | 10,000 | 13,500 | 18,000 | 80% increase |
| Bounce rate | 65% | 58% | 52% | 20% improvement |
| Avg session duration | 1:45 | 2:20 | 2:50 | 62% increase |
| Conversion rate | 2.1% | 2.8% | 3.5% | 67% increase |
| Pages per session | 2.3 | 3.1 | 3.8 | 65% increase |
This comparison table shows realistic progression for a well-executed traffic analysis and optimization program. Individual results vary based on industry, competition, and starting point, but the pattern of steady improvement holds across successful implementations.
Validate decisions by comparing performance before and after specific changes. Did optimizing mobile experience reduce bounce rate? Did targeting long-tail keywords improve conversion rates? Data answers these questions definitively, building confidence in your SEO improvement strategies and informing future priorities.
Boost your SEO analysis with BabyLoveGrowth tools
Transforming traffic insights into action requires the right technology stack. Manual analysis consumes hours that could be spent on strategy and content creation.

BabyLoveGrowth's SEO automation platform streamlines the entire optimization workflow. AI-powered tools analyze your traffic patterns, identify content gaps, and generate optimized articles that rank. The platform eliminates repetitive tasks, letting you focus on high-impact decisions.
Our organic traffic tool provides actionable recommendations based on your analytics data. Instead of drowning in reports, you get clear next steps prioritized by potential impact. The system continuously monitors performance and adjusts strategies as search algorithms evolve.
Building authority requires quality backlinks at scale. BabyLoveGrowth's SEO link building platform connects you with relevant sites for natural link exchanges. This ecosystem approach builds sustainable rankings without manual outreach drudgery, accelerating the results you've learned to measure through traffic analysis.
FAQ
What are the best metrics to focus on when analyzing organic website traffic?
Prioritize engagement metrics over vanity numbers. Bounce rate, average session duration, pages per session, and conversion rates reveal traffic quality. Track organic sessions as a volume indicator, but always pair it with engagement depth to understand true performance.
How long does it usually take to see SEO improvements after analyzing website traffic?
Expect visible improvements within 3 to 6 months of implementing data-driven changes. Google needs time to recrawl pages, reassess rankings, and validate quality signals. Consistent optimization compounds over this period, with acceleration after initial traction.
What common mistakes should I avoid when analyzing my website traffic?
Never ignore mobile traffic data, as it represents over half of web visitors. Avoid fixating on total pageviews instead of conversion metrics. Always filter bot traffic and spam referrals for accuracy. Segment traffic by source and device rather than analyzing aggregate numbers that hide important patterns.
Which tools are recommended for beginners starting website traffic analysis?
Google Analytics is the ideal starting point, offering comprehensive features at no cost. It tracks all essential metrics and integrates with other Google tools. Once comfortable with basics, add Google Search Console for search-specific insights before investing in paid platforms like SEMrush or Ahrefs.