How to measure website success: KPIs, tools, and pro tips


Most website owners are drowning in data but starving for insight. They obsess over pageviews and follower counts, then wonder why their revenue isn't moving. Vanity metrics like total pageviews are misleading and don't drive business growth on their own. This guide cuts through the noise and shows you exactly which KPIs to track, which tools to use, and how to build a measurement system that actually connects your website to real business outcomes.
Table of Contents
- Core frameworks for measuring website success
- Setting up your measurement toolkit: Tools and technologies
- Tracking core technical and performance metrics
- Distinguishing between vanity metrics and actionable KPIs
- How to create an ongoing measurement strategy
- Amplify your website success with automation and intelligent tools
- Frequently asked questions
Key Takeaways
| Point | Details |
|---|---|
| Focus on actionable KPIs | Track traffic sources, engagement, and conversions that reflect true business growth. |
| Use the right tools | Implement GA4, GSC, and speed testing tools for accurate, real-world insights. |
| Prioritize speed and user experience | Improving Core Web Vitals can dramatically boost conversions and search rankings. |
| Automate and review regularly | Automating dashboards and scheduling regular reviews ensures decisions are data-driven. |
| Ignore vanity metrics | Avoid misleading numbers and focus instead on the metrics that tie to revenue and strategic goals. |
Core frameworks for measuring website success
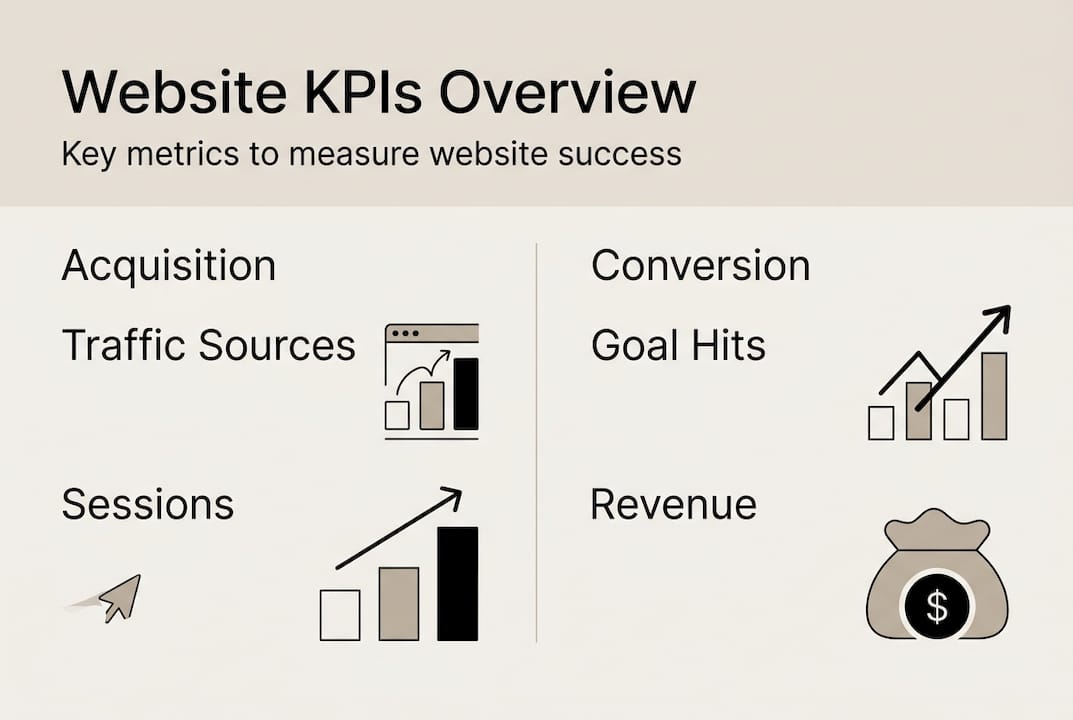
To structure your measurement, start by understanding the KPI frameworks most relevant to your goals. Every meaningful website metric falls into one of three categories: Acquisition, Engagement, or Conversion. Tracking KPIs across all three aligns your measurement with actual business goals instead of just activity.
Acquisition metrics tell you how people find your site. Think organic search traffic, referral sources, paid ad clicks, and direct visits. These help you understand which channels are working and where to invest more.
Engagement metrics reveal what visitors do once they arrive. Session duration, pages per session, and scroll depth show whether your content is resonating or falling flat.
Conversion metrics are where the money lives. Conversion rate, revenue per visitor, and goal completions tell you whether your site is actually doing its job. Outcomes tied to revenue should always be prioritized over activity-based metrics.
Here's a quick reference for how these categories map to the best tools:
| KPI Category | Key Metrics | Best Tool |
|---|---|---|
| Acquisition | Traffic sources, sessions, new users | Google Analytics 4 (GA4) |
| Engagement | Session duration, bounce rate, scroll depth | GA4, Hotjar |
| Conversion | Conversion rate, revenue, goal completions | GA4, A/B testing platforms |
| Technical | Core Web Vitals, page speed | Google Search Console, PageSpeed Insights |
| SEO Visibility | Impressions, clicks, keyword rankings | Google Search Console |
For a deeper look at which numbers actually move the needle, explore SEO metrics and marketing KPIs that align with growth-focused strategies. GA4 custom dashboards let you pull all three KPI categories into one view, making it far easier to spot patterns without jumping between platforms.
Key actionable KPIs to prioritize:
- Organic traffic by channel to identify your strongest acquisition source
- Average session duration to gauge content quality and relevance
- Conversion rate by landing page to find your highest-performing entry points
- Revenue per visitor to connect traffic directly to business value
- Return visitor rate to measure loyalty and content stickiness
Setting up your measurement toolkit: Tools and technologies
With the framework in place, you need the right tools to track and analyze those KPIs efficiently. The good news is that most of the essential tools are free or low cost. The challenge is knowing how to configure them correctly from the start.

| Tool | Type | Primary Use | Strength |
|---|---|---|---|
| Google Analytics 4 | Analytics platform | KPI tracking, user behavior | Event-based data model, free |
| Google Search Console | SEO tool | Field data, keyword performance | Real-world user data |
| PageSpeed Insights | Performance tool | Lab and field speed data | Core Web Vitals scoring |
| Optimizely / VWO | A/B testing | Conversion optimization | Statistical significance testing |
| AgencyAnalytics / Analytify | Reporting dashboards | Automated client reporting | Time-saving automation |
Setting up GA4 correctly is the foundation. Follow these steps to get it right:
- Create a GA4 property and install the tracking code via Google Tag Manager.
- Define your key events: form submissions, purchases, video plays, and scroll depth.
- Set up conversion events by marking your most important actions in GA4.
- Build a custom dashboard that surfaces your three KPI categories at a glance.
- Connect GA4 to Google Search Console for combined organic and behavioral data.
- Enable automated weekly or monthly reports so you never miss a trend.
Automating GA4 dashboards with tools like AgencyAnalytics and Analytify streamlines reporting and saves hours of manual work each month. For a complete walkthrough of setup and interpretation, the website analytics guide covers everything from configuration to advanced segmentation. You can also explore content analytics tools built specifically for content-driven growth strategies.
Pro Tip: Don't wait for problems to surface in monthly reports. Set up automated alerts in GA4 for sudden drops in traffic, conversion rate, or page speed. Early detection saves you from losing weeks of revenue.
Tracking core technical and performance metrics
Once your toolkit is ready, focus on the performance under the hood, starting with technical metrics that move the needle. Google's Core Web Vitals are the three signals that define whether your site feels fast and stable to real users.
- LCP (Largest Contentful Paint): Measures how fast your main content loads. Target: 2.5 seconds or less.
- INP (Interaction to Next Paint): Measures responsiveness to user input. Target: 200 milliseconds or less.
- CLS (Cumulative Layout Shift): Measures visual stability. Target: 0.1 or less.
These aren't just Google ranking signals. They directly affect how users feel about your site. Less than half of sites pass all three Core Web Vitals, which means improving yours is a real competitive advantage.
"A 1-second improvement in LCP can double or triple conversions and reduces bounce rates by 24%. Speed isn't a technical nicety. It's a revenue driver."
Understanding the difference between lab data and field data matters here. Lab data comes from controlled tests run by tools like PageSpeed Insights. It's consistent and great for diagnosing issues. Field data comes from real users visiting your site and is captured in Google Search Console's Core Web Vitals report. Both matter, but field data reflects actual user experience.
For a practical guide on testing website speed and interpreting results, Elementor's resource breaks down the process clearly. You can also find actionable strategies for improving site speed and understanding site speed and SEO in depth.
Pro Tip: If you run a single-page application (SPA), standard GA4 page tracking won't fire on route changes. Set up GA4 custom events triggered by URL changes to capture accurate navigation data across your app.
Distinguishing between vanity metrics and actionable KPIs
Technical metrics provide raw numbers, but interpreting them meaningfully is the next challenge. The biggest trap most business owners fall into is optimizing for metrics that feel good but don't connect to growth.
"Vanity metrics like total pageviews can be misleading. What matters most are outcomes like conversion rate and revenue per visitor."
Here's how to clean up your dashboard and focus on what counts:
- List every metric you currently track. Write them all down without filtering.
- Ask the revenue question. For each metric, ask: "If this number doubles, does our revenue grow?" If the answer is no, it's likely a vanity metric.
- Remove or deprioritize vanity metrics. Total pageviews, raw user counts, and unqualified bounce rates rarely drive decisions.
- Replace them with outcome KPIs. Add conversion rate by traffic source, revenue per session, and customer acquisition cost.
- Tie each KPI to a business goal. Every metric on your dashboard should map to a specific objective like lead generation, sales, or retention.
For example, 100,000 monthly pageviews sounds impressive. But if your conversion rate is 0.1%, you're generating 100 leads. A site with 20,000 monthly visitors and a 3% conversion rate produces 600 leads. The smaller site wins. Explore website conversions strategies to understand how to shift your focus from traffic volume to conversion quality.
Pro Tip: Revisit your KPI dashboard every quarter. As your business goals shift, so should your metrics. A KPI that was critical during a launch phase may be irrelevant six months later.
How to create an ongoing measurement strategy
Identifying the right KPIs prepares you, but ongoing measurement keeps your site aligned with business growth. A one-time audit won't cut it. You need a repeatable system.
Monitoring KPIs weekly, automating reporting, running regular A/B tests, and iterating on insights creates sustained improvement over time. Here's the process:
- Weekly KPI review: Check your core conversion and acquisition metrics every Monday. Look for anomalies, not just trends.
- Monthly performance audit: Dig into engagement metrics, Core Web Vitals scores, and content performance. Identify your top and bottom performers.
- Quarterly strategic review: Reassess your KPI framework. Are you tracking the right things? Do your goals still align with your metrics?
- Continuous A/B testing: Run at least one test per month on high-traffic pages. Test headlines, CTAs, layouts, and offers.
- Document every change: Keep a log of what you tested, what changed, and what the result was. This prevents repeating mistakes and builds institutional knowledge.
- Automate your reports: Use automating GA4 reporting tools to schedule delivery of key dashboards to your inbox or team Slack channel.
For practical tactics on increasing website engagement and improving user engagement over time, both resources offer step-by-step frameworks you can apply immediately.
Pro Tip: Schedule your quarterly strategic review on the same day each quarter. Treat it like a board meeting for your website. Block the time, pull the data in advance, and come with specific questions you want the data to answer.
Amplify your website success with automation and intelligent tools
For busy business owners and marketers, scaling these measurement strategies is most effective with the right automation tools. Manually tracking KPIs, publishing content, and building backlinks is time-consuming and inconsistent. That's where intelligent platforms change the game.
Babylovegrowth.ai is built for exactly this scenario. The platform's automated publishing feature handles content creation and distribution on autopilot, so your site keeps growing even when you're focused elsewhere. The organic traffic tool gives you a clear picture of where your traffic is coming from and how to scale what's working. And the backlink building software connects you to a backlink exchange ecosystem that amplifies your domain authority without the manual outreach grind. If you're serious about turning your measurement strategy into measurable growth, this is the infrastructure that makes it scalable.
Frequently asked questions
What are the most important website KPIs to track?
Track KPIs across three primary groups: Acquisition (traffic sources), Engagement (session duration), and Conversion (conversion rate, revenue per visitor) for the most actionable business insights.
How do I know if my website is technically healthy?
Check your Core Web Vitals scores for LCP, INP, and CLS in Google Search Console. Only 48% of mobile sites pass all three metrics, so there's a good chance at least one needs attention.
Why are vanity metrics risky for decision making?
Vanity metrics like pageviews can make your site look successful while masking poor conversion performance. Always prioritize KPIs tied directly to revenue and business outcomes.
How often should I review my website's KPIs?
Monitor KPIs weekly to catch issues early, and conduct monthly performance audits and quarterly strategic reviews to make bigger, more informed adjustments.
Recommended
Smart SEO,
Faster Growth!
Most Read Articles
Generative Engine Optimization (GEO)
Learn how Generative Engine Optimization (GEO) helps your content rank in AI search engines like ChatGPT and Google AI. This comprehensive guide explains the differences between SEO and GEO, why it matters for your business, and practical steps to implement GEO strategies for better visibility in AI-generated responses.
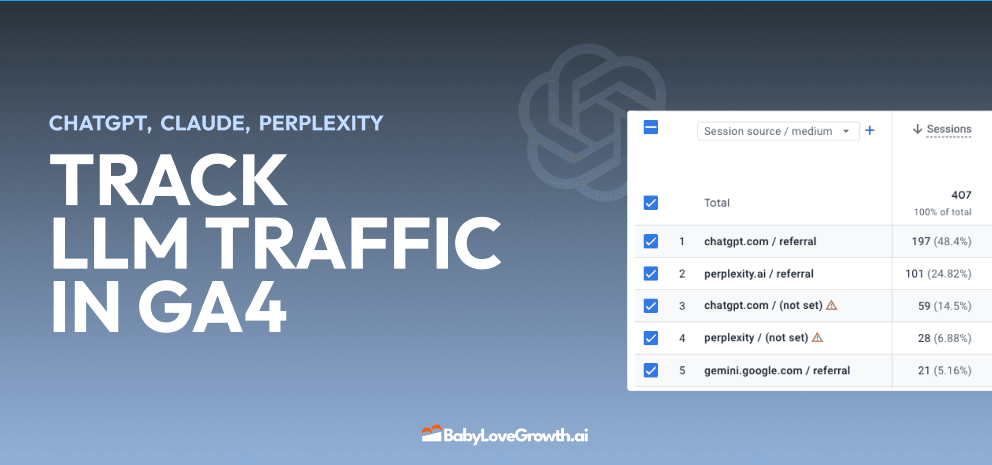
Track LLM Traffic in Google Analytics 4 (GA4)
Learn how to track and analyze traffic from AI sources like ChatGPT, Claude, Perplexity, and Google Gemini in Google Analytics 4. This step-by-step guide shows you how to set up custom filters to monitor AI-driven traffic and make data-driven decisions for your content strategy.
How to Humanize AI Text with Instructions
Learn practical techniques to make AI-generated content sound more natural and human. This guide covers active voice, direct addressing, concise writing, and other proven strategies to transform robotic text into engaging content.
Open AI Revenue and Statistics (2024)
Comprehensive analysis of OpenAI financial performance, user engagement, and market position in 2023. Discover key statistics including $20B valuation, $1B projected revenue, and 100M+ monthly active users.